内容简介
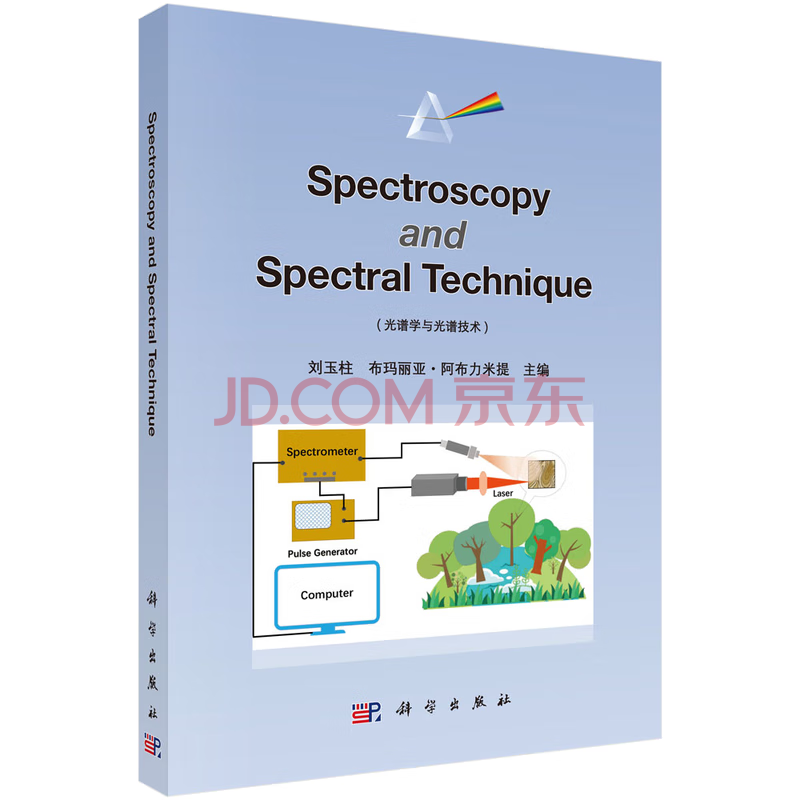
《Spectroscopy and Spectral Technique(光谱学与光谱技术)》*先系统介绍了光谱学的基础概念,包括其起源与发展、原子和分子光谱。接着,详细探讨了11种典型的光谱技术,如激光诱导击穿光谱、拉曼光谱、红外光谱等,包括其原理、实验系统及前沿应用。随后,阐述了如何在材料、环境和工业生产等领域中结合应用多种光谱技术,以及其与单一技术相比的优势。《Spectroscopy and Spectral Technique(光谱学与光谱技术)》还*特地介绍了基于机器学习的人工智能与光谱技术的结合应用。作为一大特色,结合*新科研成果,《Spectroscopy and Spectral Technique(光谱学与光谱技术)》系统设计了多项光谱仿真实验项目。*后,《Spectroscopy and Spectral Technique(光谱学与光谱技术)》展望了光谱学与光谱技术未来的发展趋势。
目录
Contents
Chapter 1 Overview of Spectral Techniques 1
1.1 The Origin of Spectral Techniques 1
1.1.1 Spectrum and Spectroscopy 1
1.1.2 The History of Spectral Techniques 1
1.2 The Development of Spectroscopy Instruments 3
1.2.1 The Development of Spectroscopic Theory 3
1.2.2 The Advent of the Laser 4
1.2.3 Development of Spectrometers 5
1.3 Atomic Energy Levels and Atomic Spectrum 5
1.3.1 Atomic Energy Level 5
1.3.2 Atomic Emission Spectroscopy 6
1.3.3 Atomic Absorption Spectrum 8
1.4 Molecular Spectrum 9
1.4.1 Molecular Vibrational Energy Levels and Corresponding Spectral Techniques 10
1.4.2 Molecular Electrons Moving Energy Levels and Corresponding Spectral Techniques 11
References 12
Chapter 2 Laser-induced Breakdown Spectroscopy 15
2.1 Birth and Development of LIBS 15
2.2 Fundamentals of LIBS 17
2.2.1 Laser-induced Plasma 17
2.2.2 Local Thermodynamic Equilibrium 18
2.2.3 Plasma Temperature and Electron Number Density 19
2.2.4 Qualitative and Quantitative Analysis 20
2.3 Instrumentation for LIBS 21
2.3.1 LIBS Experimental Setup 21
2.3.2 Online/In Situ LIBS Instruments 22
2.3.3 Signal Enhancement for LIBS 23
2.4 LIBS Applications 25
2.4.1 Environmental Monitoring 25
2.4.2 Coal Analysis 27
2.4.3 Biomedicine 29
2.4.4 Agriculture and Food Safety 31
2.4.5 Space Exploration 32
2.4.6 Ocean Exploration 34
References 35
Chapter 3 Raman Spectroscopy Technology 41
3.1 Birth and Development of Raman Spectroscopy 41
3.1.1 The Great Founder 41
3.1.2 The Birth of Raman Spectroscopy Technology 41
3.1.3 The Development of Raman Spectroscopy Technology 42
3.2 Principle of Inelastic Scattering 42
3.2.1 Nonconservation of the Kinetic Energy of Particles 42
3.2.2 Elastic and Inelastic Scattering 43
3.2.3 Raman Scattering and Rayleigh Scattering 43
3.2.4 Stokes and Anti-Stokes Lines 46
3.3 Experimental Systems for Raman Spectroscopy 50
3.3.1 The Source and Splitting of the Light 50
3.3.2 Collection and Monitoring 53
3.4 Surface-Enhanced Raman Spectroscopy 54
3.4.1 Defects of Ordinary Raman Spectroscopy 54
3.4.2 Principles of Surface-Enhanced Raman Spectroscopy 55
3.5 Important Applications of Raman Spectroscopy 56
3.5.1 Spectral Fingerprint 56
3.5.2 Real-time Detection of Liquid Phase Raman Spectroscopy Experiment 59
3.5.3 Configuration Analysis of Raman 62
References 64
Chapter 4 Differential Optical Absorption Spectroscopy 68
4.1 Development of DOAS 68
4.1.1 Development of DO AS Abroad 68
4.1.2 Domestic DOAS Development 69
4.1.3 Opportunities and Challenges 70
4.2 Principle of DOAS 71
4.2.1 Lambert-Beer,s Law 71
4.2.2 Advantages of DOAS 72
4.3 Experimental System of DOAS 73
4.3.1 Active DOAS System 73
4.3.2 Passive DOAS System (MAX-DOAS) 74
4.4 DOAS for Multi-platform 75
4.4.1 D OAS for the Ground Platform 75
4.4.2 DOAS for Mobile Platforms 76
4.4.3 Multi-platform Joint Application 77
4.5 Important Applications of DOAS 77
4.5.1 The Global Ozone Monitoring Experiment (GOME) 77
4.5.2 Gaofen-5 Satellite and Atmospheric Pollution Component Inversion Method 78
4.5.3 Determination of Plume from the Pollution Source 78
4.5.4 Planar Array Measurements of Volcanic Plumes 79
4.5.5 Comprehensive Stereoscopic Observation Network 80
References 81
Chapter 5 Infrared Spectroscopy 86
5.1 Background Introduction of Infrared Spectroscopy 86
5.1.1 Infrared Radiation 86
5.1.2 IR Region 87
5.1.3 Development of IR Spectroscopy 87
5.2 Principle of IR Spectroscopy 87
5.2.1 Principle
试读
Chapter 1 Overview of Spectral Techniques
1.1 The Origin of Spectral Techniques
1.1.1 Spectrum and Spectroscopy
The spectrum is a pattern of electromagnetic radiation intensity arranged in order of frequency from largest to smallest (or smallest to largest), which reflects the energy level structure of an entire physical system. Usually, we use a one-dimensional curve to represent the spectrum. The abscissa can be frequency, wavenumber, wavelength or energy, and the ordinate can be radiation intensity, absorbance or transmittance.
Spectroscopy is a method of studying the properties of matter through the interaction between matter and electromagnetic waves of different frequencies (or wavelengths) and is an important means of studying the microscopic particles (atoms, molecules, etc.) of matter. The spectra formed by the interaction of light and matter at different frequencies are different, and they can reflect different characteristics of microscopic particles. For example, y-rays are caused by transitions between atomic nuclei. X-rays are caused by transitions between inner electron energy levels, and ultraviolet and visible light are caused by transitions between outer electron energy levels. Near-infrared and mid-infrared light are caused by molecular vibration energy levels. Far-infrared light and microwaves are caused by transitions between the rotational energy levels of molecules, and radio waves are mainly caused by transitions between electron spin and nuclear magnetic resonance energy levels[1].
1.1.2 The History of Spectral Techniques
The concept of spectroscopy was proposed by the British physicist Newton in the 17th century. In 1666, Newton first discovered the existence of spectra experimentally. In Newton’s experiment, sunlight is refracted in a prism through small holes, and it was found that white sunlight can be dispersed into seven colors from red to purple, which is the discovery of the spectrum, and this experiment is the origin of the spectrum.
In 1802, the British chemist William Hyde Wollaston used a set of thin slits instead of the small holes in Newton’s experiment to discover that the spectrum of the sun was not actually a perfect rainbow, but was cut by some black lines. Then, in 1814, the German physicist and optical expert Joseph von Fraunhofer continued to study the solar spectrum and discovered about 574 black lines in the solar spectrum, and selected the relative positions of these black lines. As for black lines in the visible region, Fraunhofer named them A, B, C, and so on in the order of English letters from red to purple. Future generations commemorated him later, naming the black lines of the solar spectrum the Fraunhofer line. In addition, when Fraunhofer put table salt on an alcohol lamp to burn, he accidentally observed the sodium yellow line and found that the line coincided with the position of the D black line in the solar spectrum. In 1853, Angstrtom and Foucault discovered the connection between the bright line (emission spectrum) and the black line (absorption spectrum), respectively, and experimentally proved that the two yellow lines of the sodium line are consistent with the two D lines of Fraunhofer based on Fraunhofer experiment.
At the same time, due to the rapid development of electromagnetism, the spectra of electric light sources had attracted the attention of many scientists. For example, Wheatstone studied the spectra of different metal electric light sources in 1834. He recorded the number of spectral lines, their positions, and the colors of the bright lines and he finally concluded that the spectra differ between different metals.
In 1859, Kirchhoff and Bunsen first applied spectroscopes to chemical analysis and discovered the new elements cesium (Cs) and rubidium (Rb) by studying the phenomenon that metals emit the same spectr


